Mark Graban’s blog post, “What Do We Learn from Charting a Reduction in CLABSI Rates in Different Ways?”, provides a great example of how to plot and analyze data.
Here I present my analysis, observations, and comments.
The data, which appears to be a count of central line associated blood stream infections (CLABSI) for each year starting 2005 and on through 2017, is shown in Table 1. According to Mark, it was presented by some leaders from a children’s hospital.
Table 1. Data for neonatal intensive care unit (NICU) central line associated blood stream infections (CLABSI) for 2005-2017

The simplest analysis that provides insight is the best analysis to perform. So, let’s plot the data (Figure 1).
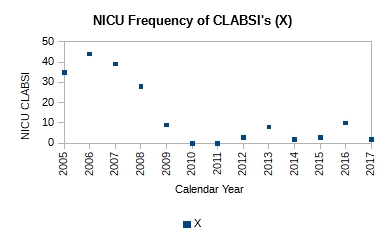 Figure 1. Plot of count of central line associated blood stream infections (CLABSI) for 2005-2017
It is obvious just from the plot in Figure 1 that the performance of the system has changed; it has improved. It has dropped from ~40 NICU CLABSIs for 2005-2007 to ~6 NICU CLABSIs for 2009-2017. Mark writes that a process change was made around 2008. However, no other details are available as to the nature of the change. Without further context all we can say is that the effect of the change made in 2008 in subsequent years is obvious and dramatic—evidence of effectiveness of action. No calculations were necessary to make this observation.
Still, we could add a center line to the plot (Figure 2) to gain further insight.
 Figure 2. The addition of the center line (average of all 13 points), clearly shows two distinct runs: a run of four points for 2005-2008, and a run of nine points for 2009-2017. The run of nine points is unusual, and signals a process shift.
The center line is the mean, calculated using all 13 points. It is ~14. From the plot we see a run of four points above the mean and a run of nine points below the mean. The second run is unusual and signals a process shift. It supports the claim that a process change was made around 2008-2009. With a single calculation, the mean, we have corroborated our original observation.
If we want to predict the performance of the system in 2018 or 2019 or 2020, we need to construct an XmR chart. Knowing that there was a process change around 2008, we should focus on the system’s performance after that i.e. 2009 and beyond. Table 2 shows the calculations for the XmR chart.
Table 2. Calculations are shown for attributes necessary to plot an XmR chart. The calculations are shown just for the process thought to currently exist i.e. 2009-2017

The moving range (mR) is calculated as the absolute value of the difference between the current and previous year e.g. mR for 2010 is calculated as |X2010 – X2009| = |0 – 9|, which is 9.
The mean value is calculate for just those points after the process change, i.e. 2009-2017, as (9+0+0+3+8+2+3+10+2)/9 = 37/9 = 4.1
The mean moving range is calculate as the average of all the calculated moving range values as (9+0+3+5+6+1+7+8)/8 = 39/8 = 4.9
The upper natural limit (UNL) is calculated as the mean + 2.66*mean range i.e. 4.1 + 2.66*4.9 = 17
The lower natural limit (LNL) is calculate as the mean – 2.66*mean range i.e. 4.1 – 2.66*4.9 = -9. However, because you cannot have negative count, the LNL is set to zero on the chart.
The upper range limit (URL) is calculated as 3.268*mean range i.e. 3.268*4.9 = 15.9
The lower range limit (LRL) is zero.
The XmR chart is shown in Figure 3.
 Figure 3. The natural process limits are shown for the current system with the UNL = 17, mean = 4.1, and LNL = 0. If the system continued to perform without change, we can expect between 0 and 17 CLABSIs in the next years.
From the XmR chart we can make the following predictions:
Provided the system continues to operate as it has the past few years, we can expect an average of ~4 CLABSIs in future years. There may be years where we could see up to ~17 CLABSIs. There may be years where there are none. Further more we can expect the counts to vary by ~5 on average from one year to the next. Some years may vary by as much as 16 counts. Others may not vary at all.
Management must decide whether this is adequate performance. If further reduction in NICU CLABSIs is wanted, new actions to improve the current system will need to be taken.
Links
[1] Graban, Mark. What Do We Learn from Charting a Reduction in CLABSI Rates in Different Ways?. Retrieved on 2017.11.01 from https://www.leanblog.org/2017/11/learn-charting-reduction-clabsi-rates-different-ways/

