It’s (Mostly) The System Not The Person

A common theme running through many recent articles, blog posts, and comments on issues of organizational performance is that managers/leaders are the problem: they are out of touch, they are arrogant and smug, they are selfish, and that they lack empathy or compassion. The gist being people in positions of power or authority should know better, be better.
I agree with Rasmus Hougaard and Jacqueline Carter, authors of the piece “Why Do So Many Managers Forget They’re Human Beings?” in Harvard Business Review, that “As human beings, we are all driven by basic needs for meaning, happiness, human connectedness, and a desire to contribute positively to others.”[1] This is so for the line-worker and the executive. I do not believe that anyone comes to work with the intent to make life miserable for another. But it happens. Why?
Religions have been telling us to “Be personal,” “Be self-aware,” “Be selfless,” “Be compassionate,” for ages. That is wise guidance for leaders and common man alike. But, as Dr. Deming asked, “By what method?” Without method that guidance is no different than exhorting a worker to “think quality,” “work hard,” “zero defects,” “get it right first time.”
Method, or process, or system, is essential in supporting our inner desire to live right. Organizations have organically evolved systems that directly conflict with and obstruct this desire. They’re so elaborate that even those supposedly in charge are trapped by it.[2] This isn’t intentional, it happens. It is the result of everyone doing their best without constancy of purpose. I now realize that no one in the system sees the system, and everyone is confused by and frustrated with it. What can we do?
We can all work to understand the system and share that with one another. Leaders can authorize that. However, we all are responsible for doing it. With shared understanding we can all work to redesign our system of work to humanize it. Again, leaders can authorize that, but we are all responsible for doing it. It is easy and comforting to divide ourselves into “us” and “them” and lay responsibility and fault on “them”. We’ve tried that; it hasn’t worked. Could we try something different?
It’s not just the managers who forget they’re human. We all do.
Links
[1] Hougaard, Rasmus and Jacqueline Carter. “Why Do So Many Managers Forget They’re Human Beings?” Retrieved on 2018.01.30 from https://hbr.org/2018/01/why-do-so-many-managers-forget-theyre-human-beings
[2] Consider Eric Ries’s experience from The Startup Way: “Many managers I’ve met and worked with know they’re being asked to do the wrong thing, but they continue to do it anyway because they feel trapped in a system of incentives that makes it impossible to do anything else.”
“Why?” Not “Who?”: Fixing Systems, Not Blaming Workers

Recently, Harvard Business Review published a video called “The 5 Whys” where Eric Ries, author of The Lean Startup and The Startup Way, explains the use of the method. He repeatedly, and incorrectly, suggests to the viewer that “behind every seemingly technical problem is actually a human problem waiting to be found.” Finding a human who failed to be singled out for blame won’t find and fix the deficiencies in the process or system. What we need is to improve the design of the process or system within which humans work.
…
You can read the full post on Mark Graban’s Lean Blog. Please click on the link — https://www.leanblog.org/2018/01/not-fixing-systems-not-blaming-workers/


Charting Change: Using an XmR Chart
Mark Graban’s blog post, “What Do We Learn from Charting a Reduction in CLABSI Rates in Different Ways?”, provides a great example of how to plot and analyze data.
Here I present my analysis, observations, and comments.
The data, which appears to be a count of central line associated blood stream infections (CLABSI) for each year starting 2005 and on through 2017, is shown in Table 1. According to Mark, it was presented by some leaders from a children’s hospital.
Table 1. Data for neonatal intensive care unit (NICU) central line associated blood stream infections (CLABSI) for 2005-2017

The simplest analysis that provides insight is the best analysis to perform. So, let’s plot the data (Figure 1).
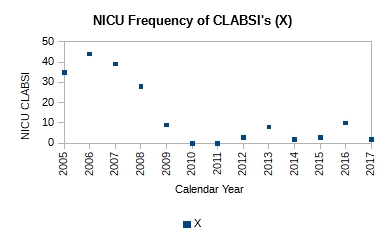 Figure 1. Plot of count of central line associated blood stream infections (CLABSI) for 2005-2017
It is obvious just from the plot in Figure 1 that the performance of the system has changed; it has improved. It has dropped from ~40 NICU CLABSIs for 2005-2007 to ~6 NICU CLABSIs for 2009-2017. Mark writes that a process change was made around 2008. However, no other details are available as to the nature of the change. Without further context all we can say is that the effect of the change made in 2008 in subsequent years is obvious and dramatic—evidence of effectiveness of action. No calculations were necessary to make this observation.
Still, we could add a center line to the plot (Figure 2) to gain further insight.
 Figure 2. The addition of the center line (average of all 13 points), clearly shows two distinct runs: a run of four points for 2005-2008, and a run of nine points for 2009-2017. The run of nine points is unusual, and signals a process shift.
The center line is the mean, calculated using all 13 points. It is ~14. From the plot we see a run of four points above the mean and a run of nine points below the mean. The second run is unusual and signals a process shift. It supports the claim that a process change was made around 2008-2009. With a single calculation, the mean, we have corroborated our original observation.
If we want to predict the performance of the system in 2018 or 2019 or 2020, we need to construct an XmR chart. Knowing that there was a process change around 2008, we should focus on the system’s performance after that i.e. 2009 and beyond. Table 2 shows the calculations for the XmR chart.
Table 2. Calculations are shown for attributes necessary to plot an XmR chart. The calculations are shown just for the process thought to currently exist i.e. 2009-2017

The moving range (mR) is calculated as the absolute value of the difference between the current and previous year e.g. mR for 2010 is calculated as |X2010 – X2009| = |0 – 9|, which is 9.
The mean value is calculate for just those points after the process change, i.e. 2009-2017, as (9+0+0+3+8+2+3+10+2)/9 = 37/9 = 4.1
The mean moving range is calculate as the average of all the calculated moving range values as (9+0+3+5+6+1+7+8)/8 = 39/8 = 4.9
The upper natural limit (UNL) is calculated as the mean + 2.66*mean range i.e. 4.1 + 2.66*4.9 = 17
The lower natural limit (LNL) is calculate as the mean – 2.66*mean range i.e. 4.1 – 2.66*4.9 = -9. However, because you cannot have negative count, the LNL is set to zero on the chart.
The upper range limit (URL) is calculated as 3.268*mean range i.e. 3.268*4.9 = 15.9
The lower range limit (LRL) is zero.
The XmR chart is shown in Figure 3.
 Figure 3. The natural process limits are shown for the current system with the UNL = 17, mean = 4.1, and LNL = 0. If the system continued to perform without change, we can expect between 0 and 17 CLABSIs in the next years.
From the XmR chart we can make the following predictions:
Provided the system continues to operate as it has the past few years, we can expect an average of ~4 CLABSIs in future years. There may be years where we could see up to ~17 CLABSIs. There may be years where there are none. Further more we can expect the counts to vary by ~5 on average from one year to the next. Some years may vary by as much as 16 counts. Others may not vary at all.
Management must decide whether this is adequate performance. If further reduction in NICU CLABSIs is wanted, new actions to improve the current system will need to be taken.
Links
[1] Graban, Mark. What Do We Learn from Charting a Reduction in CLABSI Rates in Different Ways?. Retrieved on 2017.11.01 from https://www.leanblog.org/2017/11/learn-charting-reduction-clabsi-rates-different-ways/
Coffee Shop Epiphanies: Influences of Design on Behavior

Coffee shops provide a great opportunity to observe the flow of product from customer order and collection of cash to the delivery of the order and order pickup by the customer.
The coffee shop I sit at has the entrance for its order queue close to the entrance to the store. So, when customers walk into the store they immediately find themselves in queue to place their order. The customers place their order at one of two cash registers that are set side by side along the path of the flow. They then walk further to the end of the line where their order is delivered. In a relative measure, the exit of the queue is much farther from the store entrance than the entrance of the queue.
Recently I made a couple of observations:
1. Some customers order specialty coffee products (e.g. espressos, lattes, etc.), while others order brewed coffee. Specialty coffee products takes time to make while brewed coffee is ready to serve on demand.
Customers who order specialty coffee products move to the end of line and wait there for their order. Almost all of them wait right at exit of the queue. During a surge a cluster of people forms there essentially blocking the exit.
Customers who order brewed coffee have their coffee delivered to them right at the cash registers. Their order is not delivered at the end of line. So these customers, almost exclusively, exit the queue through the entrance of the queue instead of taking their order and following the line and exiting at its end. I suspect two contributing factors: the exit to the store is closer to the entrance of the queue, and the exit of the queue is blocked by the cluster of people waiting to pick up their order.
2. Many customers after picking up their order from the end of line still do not exit from there. They instead move back through the queue and exit through the queue entrance and then on through the store exit. I suspect that is because there is no direct way to exit the store from the exit of the queue. The customer has to navigate through the seating area.
As I made my observations on how people were behaving, I found myself getting irritated. Why couldn’t these customers, who had a brain and the ability to sense their environment, follow the line from the queue entrance to the queue exit and then out of the store? It’s not hard! Stop creating back-flows! How inconsiderate! So selfish! So oblivious! Ugh! I’m sure my disgust was plainly apparent on my face. I recall my many sanctimonious conversations with friends and colleagues on the thoughtless behavior of people.
Then I experienced an epiphany. My mind, without my conscious awareness, flipped its perspective and answered the question, “What is it about the design of the space that led people to use it in the way they were?” It shifted from blaming the human to accepting human behavior as an uncontrollable factor and addressing the inadequacy of the design of the space that enabled humans to behave in an undesirable way. That released my mind from being stuck and frustrated to feeling creative. With that one realization, my mind started working on redesigning the space.
Still, I wanted to continue observing the activity to understand it a little more deeply. But what happened caught me by surprise. Even though I had had the epiphany that the design of the space was the problem, and that people were responding to the design, I still found myself getting irritated with them for what I ascribed to them as their conscious decisions. That triggered my second epiphany, that unless I consciously focused on the first epiphany, my mind will naturally shift to blaming people for their behavior instead of the design of the space that enables it.
Postscript: Our brain evolved in an environment to notice activity that signaled potential danger: movement, sound, smell, etc. So it is biased to see this foreground. So much so that most times it doesn’t even see the background; the relatively unchanging environment. People and their behavior are always in the foreground. The context for their behavior, the design of the space, is in the background. When we are faced with behavior problems, our mind instinctively focuses on the human, rather than his environment. It takes conscious awareness to not do that.
Understanding How You Fit In

Early on in my career my thoughts about the world and work were fragmentary. They often conflicted with one another. These conflicting disorganized thoughts were the source of a lot of confusion and frustration.
Then I read W. Edwards Deming’s Out of the Crisis[1]. On page 4, Fig. 1 shows a diagram of “Production viewed as a system”. It instantly reshaped my perspective. I had an “Aha!” moment. It gave me the context to understand my differentiated knowledge and experience. I understood where and how I fit in.
I sense that most people suffer from confusion and frustration from a lack of context for what they do. While I believe everyone should buy and read Out of the Crisis, it is not an easy read for the new worker.
This year I discovered two books that I feel are more accessible: Improving Performance Through Statistical Thinking[2] and Statistical Thinking: Improving Business Performance[3]. Both provide the worker a frame for understanding their job, how it fits within an organization, and how to work better, both individually and together.
These books aren’t just for quality people. In fact I think they are more helpful to everyone else–Marketing, R&D, Design & Development, Manufacturing, Sales, Accounting, Finance, Legal, and any other department I might have missed. I think every worker who reads them will have an “Aha!” moment, and can immediately benefit from them.
Dr. Deming pointed out, “It is not enough to do your best; you must know what to do, and then do your best.” You already do your best, but with confusing and frustrating results. These books are wonderful resources to help you understand what you should do so that your best efforts produce satisfying results; ones that make you feel good and proud.
I feel it’s important for me to say this: Don’t let the reference to Statistics in their titles scare you off. You don’t need to know any Statistics to read them. In fact, I feel you will benefit more if you didn’t know any Statistics. You will learn three important lessons from these books:
- All work occurs in a system of interconnected processes
- Variation exists in all processes, and
- Understanding and reducing variation are keys to success
Links
[1] Deming, W. Edwards. Out of the Crisis. Cambridge, MA: Center for Advanced Engineering Study, MIT. 1991. Print. ISBN 0-911379-01-0
[2] Britz, Galen C., Donald W. Emerling, Lynne B. Hare, Roger W. Hoerl, Stuart J. Janis, and Janice E. Shade. Improving Performance Through Statistical Thinking. Milwaukee, WI: ASQ Quality Press. 2000. Print. ISBN 0-87389-467-7
[3] Hoerl, Roger, and Ronald D. Snee. Statistical Thinking: Improving Business Performance. Pacific Grove, CA: Duxbury, Thomson Learning. 2002. Print. ISBN 0-534-38158-8
It’s the Work, Stupid!

Yesterday I had an interview with the Human Resources Director of the company. He asked me what I was looking for in my next job. I shared that I was looking for a good group of people to work with. I was looking to build relationships with my coworkers wherein I could help them feel good about the work they were doing. I was looking for a company where I could reduce wasted effort, boost productivity, and build pride in personal craftsmanship.
This was music to his ears, and he said as much. He said that the company wanted to be an employer of choice. He shared the effort made by the company to improve its culture to that end. Like many of my previous employers, they had surveyed their employees to find out what management could do. Employees, while happy with the cafeteria, had said the food was too expensive. So the company decided to subsidize it with $20 per employee. They also started making people take their birthdays off.
Sounds good, doesn’t it? It makes it appear as if management was listening and responding to employees, that it cares for their well-being.
The trouble is that such actions do nothing to improve an individual work process or the system within which workers work. And we all know by now that the bulk of the problems workers deal with reside in the process or system. Workers are powerless to affect them. What does subsidizing the cost of a meal do for improving the way work gets done? How does making people take their birthdays off boost productivity? Will installing an espresso machine help with reducing rework?
The assumption going into providing such fringe benefits (perks) is that problems are the result of workers holding back. That workers do not give their all or that they do not do their best. If only management rewarded them more, then workers would work better. Much has been written about the negative impact of boosting extrinsic rewards without changing the work process or system. Rather than feeling better, workers become more stressed, make more mistakes, take more time.
Management’s diagnosis of the cause of productivity problems is fundamentally flawed. Worse, management knows it. But working on the system to improve it requires management to work in ways they are not prepared to. Effects of changes to the system are not immediate nor are they easily perceived. But providing fringe benefits makes a real splash, however short-lived it might be. So here’s to hoping the pizza and beer will stop all of you workers from whining!
On Variation and Some of its Sources

Virtually every component is made to be assembled with its counterpart(s) into sub-assemblies and final assemblies.
If individual pieces of a given component could be made identical to one another, then they would either all conform or all fail to conform to the component’s design requirements. If they conform, then we could pick a piece at random for use in a sub- or final-assembly. It would fit and function without fail, as intended.
But material varies, machine operation varies, the work method varies, workers vary, measurement varies, as does the environment. Such variation, especially in combination, makes it impossible to produce anything identical. Variation is a fundamental principle of nature. All things vary.
Variation affects the fit, the form and the function of a component. And, it is propagated along the assembly line such that the final product is at times a mixed bag of conforming and nonconforming widgets.
Material Consider 316 Stainless Steel. It is used to make medical devices. Manufacturers buy it from metal producers in sheet stock or bar stock.
If we measured the dimensional attributes of the received stock, e.g. its diameter or length, for several different purchase orders, we would see that they were not identical between orders. They vary. If we measured these attributes for pieces received in a single order, we would see that they were not identical between pieces of that order either. If we measured these attributes for a single piece at different points in its cross-section, we would see that they, too, were not identical. If we then zoomed in to investigate the crystalline structure of the stainless steel, we would see that the crystals were not identical in shape or size.
The elemental composition, in percent by weight, of 316 Stainless Steel is: 0.08% Carbon, 2.00% Manganese, 0.75% Silicon, 16.00-18.00% Chromium, 10.00-14.00% Nickel, 2.00-3.00% Molybdenum, 0.045% Phosphorous, 0.030% Sulfur, 0.10% Nitrogen, and the balance is Iron. We see that the amount of Chromium, Nickel, Molybdenum and Iron are specified as ranges i.e. they are expected to vary within them by design!
These are some of the ways a specific raw material used in the production of medical devices varies. Keep in mind that a medical device isn’t a single component but an assembly of several components likely made of different materials that will vary in just such ways as well. All this variation affects the processing (i.e. machining, cleaning, passivation, etc.) of the material during manufacturing, as well as the device performance in use.
Machine One piece of equipment used in the production of medical device components is the CNC (Computer Numerical Control) machine. Its condition, as with all production equipment, varies with use.
Take the quality of the lubricating fluid: it changes properties (e.g. its viscosity) with temperature thus affecting its effectiveness. The sharpness of the cutting tool deteriorates with use. A component made with a brand new cutting tool will not be identical to one made from a used cutting tool whose cutting edges have dulled. The cutting is also affected by both the feed-rate and the rotation-rate of the cutting tool. Neither of which remain perfectly constant at a particular setting.
What’s more, no two machines perform in identical ways even when they are the same make and model made by the same manufacturer. In use, they will almost never be in the same state as each other, with one being used more or less than the other, and consumables like cutting tools in different states of wear. Such variability will contribute to the variability between the individual pieces of the component.
Method Unless there is standardized work, we would all do the work in the best way we know how. Each worker will have a best way slightly different from another. Variation in best ways will find its way into the pieces made using them.
These days a production tool like a CNC machine offers customized operation. The user can specify the settings for a large number of operating parameters. Users write “code” or develop a “recipe” that specifies the settings for various operating parameters in order to make a particular component. If several such pieces of code or recipes exist, one different from another, and they are used to make a particular component, they will produce pieces of that component that vary from one to another.
When and how an adjustment is made to control parameters of a tool will affect the degree of variation between one piece and another. Consider the method where a worker makes adjustment(s) after each piece is made to account for its deviation from the target versus one where a worker makes an adjustment only when a process shift is detected. Dr. Deming and Dr. Wheeler have shown that tampering with a stable process, as the first worker does, will serve to increase the variation in the process.
All such variation in method will introduce variability into the manufactured pieces.
Man There are a great many ways in which humans vary physically from one another. Some workers are men, others are women. Some are short, others are tall. Some are young, others are older. Some have short fat fingers, others have long thin fingers. Some have great eyesight, others need vision correction. Some have great hearing, others need hearing aids. Some are right handed, others are left handed. Some are strong, others not so much. Some have great hand-eye coordination, others do not. We all come from diverse ethnic backgrounds.
Not all workers have identical knowledge. Some have multiple degrees, others are high school graduates. Some have long experience doing a job, others are fresh out of school. Some have strong knowledge in a particular subject, others do not. Some have deep experience in a single task, others have shallow experience. Some have broad experience, others have focused experience.
Last, but not least, we all bring varying mindsets to work. Some may be intrinsically motivated, others need to be motivated externally. Some may be optimists, others may be pessimists. Some want to get better everyday, others are happy where they are. Some like change, others resist it. Some are data driven, others use their instinct.
All this variation affects the way a job gets done. The variation is propagated into the work and ultimately manifests itself in the variation of the manufactured component.
Measurement We consider a measured value as fact, immutable. But that’s not true. Measuring the same attribute repeatedly does not produce identical results between measurements.
Just like production tools, measurement tools wear from use. This affects the measurement made with it over the course of its use.
And also just like production tools, the method (e.g. how a part is oriented, where on the part the measurement is made, etc.) used to make a measurement affects the measured value. There is no true value of any measured attribute. Different measurement methods produce different measurements of the same attribute.
So even if by chance two pieces were made identical we wouldn’t be able to tell because of the variability inherent in the measurement process.
Environment Certain environmental factors affect all operations regardless of industry. One of them is time. It is not identical from one period to the next. Months in a year are not identical in duration. Seasons in a year are different from one another. Daytime and nighttime are not identical to one another. Weekdays and weekends are not identical to one another.
Even in a climate controlled facility the temperature cycles periodically around a target. It varies between locations as well. Lighting changes over the course of the day. Certain parts of the workplace may be darker than others. Noise, too, changes over the course of the day: quiet early in the morning or into the night, and noisier later into the day. There is variation in the type of noise, as well. Vibration by definition is variation. It can come from a heavy truck rolling down the street or the motor spinning the cutting tool in a production machine. Air movement or circulation isn’t the same under a vent as compared to a spot away from a vent, or when the system is on versus when it is off.

The 5M+E (Material, Machine, Method, Man, Measurement, and Environment) is just one way to categorize sources of variation. The examples in each are just a few of the different sources of variation that can affect the quality of individual pieces of a component. While we cannot eliminate variation, it is possible to systematically reduce it and achieve greater and greater uniformity in the output of a process. The objective of a business is to match the Voice of the Customer (VOC) and the Voice of the Process (VOP). The modern day world-class definition of quality is run-to-target with minimal variation!
“Our approach has been to investigate one by one the causes of various “unnecessaries” in manufacturing operations…”
— Taiichi Ohno describing the development of the Toyota Production System
Links
[1] Kume, Hitoshi. Statistical Methods for Quality Improvement. Tokyo, Japan: The Association for Overseas Technical Scholarship. 2000. Print. ISBN 4-906224-34-2
[2] Monden, Yasuhiro. Toyota Production System. Norcross, GA: Industrial Engineering and Management Press. 1983. Print. ISBN 0-89806-034-6
[3] Wheeler, Donald J. and David S. Chambers. Understanding Statistical Process Control. Knoxville, TN: SPC Press, Inc. 1986. Print. ISBN 0-945320-01-9
Some Thoughts on the Toyota Production System

The Toyota production system (TPS) was not designed.
“The technique we call the Toyota production system was born through our various efforts to catch up with the automotive industries of western advanced nations…”
— Taiichi Ohno, Foreword to Toyota Production System[1]
It grew out of “various efforts.” Often these efforts were “trial and error.” Experiments were run, lots of them. Some yielded desirable results, others did not. But lessons could be learned from every experiment—What worked? What didn’t? Why?
What made an outcome of an experiment desirable? What was the purpose of these efforts?
“Above all, one of our most important purposes was increased productivity and reduced costs.“
So how was productivity increased and costs reduced? Toyota guessed (or hypothesized) this could be done by “eliminating all kinds of unnecessary functions in the factories,” what we’ve come to term as waste. We all recognize there are many ways to produce the same result. However, some are less wasteful than others. They are efficient.
By attending to what is actually happening, by observing the real process, a worker could identify waste in various forms. Observation comes before understanding.
“Our approach has been to investigate one by one the causes of various “unnecessaries” in manufacturing operations…“
One by one!
If we take a minute to think about how many different operations—small and large, localized and cross-functional—take place in factories, we start to understand the scale of Toyota’s effort. That takes patience, discipline and perseverance i.e. grit. The image of a bee hive or a migrating wildebeest herd or a flock of starlings comes to my mind. There is no centralized design or control, nevertheless all members work with the same purpose.
“…and to devise methods for their solution…“
To eliminate the causes of different types of waste, i.e. the unnecessary functions in the factories, Toyota devised solutions such as kanban, just-in-time, production smoothing, and autonomation. These methods are outcomes of a way of thinking and being. Experimentation through trial and error. They are the means Toyota developed to achieve its purpose of increasing productivity and reducing costs. They could be spread within Toyota, but can they be used elsewhere? Many examples exist of attempts to incorporate them in companies here in the West. I’ve had a front row seat to many of them. Few, if any, show the type of sustained benefits seen by Toyota. Why is that? Context!
“Although we have a slight doubt whether our Just-in-time system could be applied to the foreign countries where business climates, industrial relations, and many other social systems are different from ours, we firmly believe there is no significant difference among the final purposes of the firms and the people working in them.“
All companies operate within an environment: business climates (e.g. the regulatory environment), industrial relations (i.e. how companies relate to their peers and their suppliers, their communities, and the natural environment), and social systems (such as local traditions and customs). These will necessarily affect the type and form of tools that emerge from experiments that (should) happen in support of a particular company’s purpose. By the way, contrary to Ohno’s point, and as irrational as it seems, not all companies have the same final purpose as Toyota—to increase productivity and reduce costs. Similarly, people in the West have different objectives, different worldviews, than those in the East.
The Toyota production system, and perhaps even lean, is a way of being in pursuit of certain purpose(s). They are not a set of tools to copy and deploy independent of and indifferent to the context where they are deployed. It shouldn’t surprise anyone that efforts to unthinkingly copy and apply them fail more often than succeed.
Links
[1] Monden, Yasuhiro. Toyota Production System. Norcross, GA: Industrial Engineering and Management Press. 1983. Print. ISBN 0-89806-034-6
Reliability, Confidence, and Sample Size, Part II

In Part I the problem was to find the sample size, n, given failure count, c = 0, confidence level = 1 – P(c = 0), and minimum reliability = (1 – p’). The table giving sample size, n, with failures c = 0, for certain common combinations of confidence level and minimum reliability is reproduced below.

While I would like that none of the samples fail testing, failures do happen. Does that mean testing should stop on first fail? Are the test results useless? In this part I will flip the script. I will talk about what value I can extract from test results if I encounter one or more failures in the test sample.
I start with the binomial formula as before

It gives us the likelihood, P(x = c), of finding exactly c failures in n samples for a particular population failure rate p’. (Note that 1 – P(x ≤ c) is our confidence level, and 1 – p’ = q’ is our desired reliability.)
However, knowing the likelihood of finding just c failures in n samples isn’t enough. Different samples of size n from the same population will give different counts of failures c. If I am okay with c failures in n samples, then I must be okay with less than c failures, too! Therefore, I need to know the cumulative likelihood of finding c or less failures in n samples, or P(x ≤ c). That likelihood is calculated as the sum of the individual probabilities. For example, if c = 2 samples fail, I calculate P(x ≤ 2) = P(x = 2) + P(x = 1) + P(x = 0).
For a particular failure rate p’, I can make the statement that my confidence is 1 – P(x ≤ c) that the failure rate is no greater than p’ or alternatively my reliability is no less than q’ = (1 – p’).
It is useful to build a plot of P(x ≤ c) versus p’ to understand the relationship between the two for a given sample size n and failure count c. This plot is referred to as the operating characteristic (OC) curve for a particular n and c combination.
For example, given n = 45, and c = 2, my calculations would look like:


The table below shows a few values that were calculated:

A plot of P(c ≤ 2) versus p’ looks like:

From the plot I can see that the more confidence I require, the higher the failure rate or lesser the reliability estimate will be (e.g. 90% confidence with 0.887 reliability, or 95% confidence with 0.868 reliability.) Viewed differently, the more reliability I require, the less confidence I have in my estimate (e.g. 0.95 reliability with 40% confidence level).
Which combination of confidence and reliability to use depends on the user’s needs. There is no prescription for choosing one over another.
I may have chosen a sample size of n = 45 expecting c = 0 failures for testing with the expectation of having 90% confidence at 0.95 reliability in my results. But just because I got c = 2 failures doesn’t mean the effort is for naught. I could plot the OC curve for the combination of n, and c to understand how my confidence and reliability has been affected. Maybe there is a combination that is acceptable. Of course, I would need to explain why the new confidence, and reliability levels are acceptable if I started with something else.
Operating characteristic curves can be constructed in MS Excel or Libre Calc with the help of BINOM.DIST(c, n, p’, 1) function.

Once I have values for p’ and P(c ≤ 2), I can create an X-Y graph with X = p’, and Y = P(c ≤ 2).
Links
[1] Burr, Irving W. Elementary Statistical Quality Control. New York, NY: Marcel Dekker, Inc. 1979. Print. ISBN 0-8247-6686-5

