Why do you hang out with me?
Friend #1
Why do you hang out with me?
Friend #2
Because I can be me around you.
Friend #1
How so? I don’t think I understand what you mean.
Friend #2
Have you ever had a new pair of shoes pinch?
Friend #1
For sure! I have scars to prove it.
Friend #2
It’s like that. The pinching makes you uncomfortable. It grabs your attention until you do something to relieve the discomfort. You can’t attend to anything else. You can’t enjoy the good qualities of the shoes either.
Friend #1
Okay, but how is that related to you hanging out with me?
Friend #2
You don’t pinch like the shoe, so I don’t feel uncomfortable. I can be me. And I get to enjoy the goodness you are.
Some Thoughts on Compassion
A friend of mine shared that while she was sick in bed on this particular morning her husband waited for her to wake up to make him breakfast. She complained about his lack of compassion toward her. His actions in this case were clearly inconsiderate, and even hurtful. But not all failures to be compassionate are so easily seen. Most occur in very subtle ways, and they occur every moment.
The roots of the word compassion are the Latin com, which means with, and pati, which means to suffer. So compassion meant to suffer with. But today we view that definition more as empathy. The modern understanding of compassion goes beyond empathy. It includes action motivated by an internal desire to alleviate the suffering of another.
However, before we can be compassionate we must deeply understand the suffering of others. When we suffer with them, when we exercise our empathy for them, we come closer to understanding their suffering. Without such an understanding there can be no right action.
Similarly, before we can empathize, we must first be aware of the suffering of others; we must accept the fact it exists. That comes from attention. If we are inattentive or oblivious to our environment, if we ignore what is happening, then we remain unaware of the suffering. Without attention there can be no awareness, and without awareness there can be no empathy.
So in empathizing with another we “suffer with” them. But in doing so, if we are inattentive, we may act to relieve the personal suffering generated by our empathy rather than alleviating that of the other. This substitution is very subtle and happens all the time. Such action isn’t compassionate. It is not motivated by a desire to alleviate the suffering of another. Instead it is motivated by the desire to relieve our own suffering caused by the suffering of another.
Compassionate action flows naturally from clear understanding. Sometimes this action takes a positive form i.e. it requires we actually do something. Other times it takes on a negative form i.e. we stop doing something. Our whole lives we are conditioned to think that all action must take the positive form. “Don’t just stand there. Do something!” These days I am trying to just stand still and stop all my actions that have been adding to the suffering of others.
Unsurprisingly, this has created suffering of its own.
Book List (2019)
- The Dhammapada: A New Translation of the Buddhist Classic with Annotations https://www.amazon.com/dp/1590303806/
- Grammatical Man: Information, Entropy, Language and Life https://www.amazon.com/dp/0671440624/
- Access 2016 in easy steps https://www.amazon.com/Access-2016-easy-steps-McGrath/dp/1840787732/
- Computer Power and Human Reason: From Judgment to Calculation https://www.amazon.com/Computer-power-human-reason-calculation/dp/0716704641/
- The Meaning of Human Existence https://www.amazon.com/Meaning-Human-Existence-Edward-Wilson-dp-0871401002/dp/0871401002/
- The Molecule of More: How a Single Chemical in Your Brain Drives Love, Sex, and Creativity―and Will Determine the Fate of the Human Race https://www.amazon.com/gp/product/1946885118/
- The Certified Supplier Quality Professional Handbook https://www.amazon.com/Certified-Supplier-Quality-Professional-Handbook/dp/0873899431/
- The Four Noble Truths https://www.amazon.com/Four-Noble-Truths-Lobsang-Gyatso/dp/1559390271/
- Advice Not Given: A Guide to Getting Over Yourself https://www.amazon.com/Advice-Not-Given-Getting-Yourself/dp/0399564322/
- Humble Inquiry: The Gentle Art of Asking Instead of Telling https://www.amazon.com/Humble-Inquiry-Gentle-Instead-Telling/dp/1626567344/
- Why Buddhism is True: The Science and Philosophy of Meditation and Enlightenment https://www.amazon.com/Why-Buddhism-True-Philosophy-Enlightenment/dp/1439195455/
Book List (2018)


- The Path of Least Resistance https://www.amazon.com/path-least-resistance-Principles-creating/dp/0930641000/
- A Universe from Nothing: Why There Is Something Rather than Nothing https://www.amazon.com/Universe-Nothing-There-Something-Rather/dp/1451624468/
- Writing to Learn — https://www.amazon.com/Writing-Learn-Write-Clearly-Subject/dp/B000OEVVL4/
- Elastic: Flexible Thinking in a Time of Change — https://www.amazon.com/Elastic-Flexible-Thinking-Time-Change/dp/1101870923/
- The Upright Thinkers: The Human Journey from Living in Trees to Understanding the Cosmos — https://www.amazon.com/Upright-Thinkers-Journey-Living-Understanding/dp/0307908232/
- Beyond Violence — https://www.amazon.com/Beyond-Violence-J-Krishnamurti/dp/0060648392/
- The Mind Club: Who Thinks, What Feels, and Why It Matters — https://www.amazon.com/dp/0670785830/
- The Deming Dimension — https://www.amazon.com/Deming-Dimension-Henry-R-Neave/dp/0945320361/
- The Theoretical Minimum — https://www.amazon.com/Theoretical-Minimum-Start-Doing-Physics/dp/046502811X/
- Midnight’s Furies — https://www.amazon.com/Midnights-Furies-Deadly-Legacy-Partition/dp/0544705394/
- The Big Picture — https://www.amazon.com/Big-Picture-Origins-Meaning-Universe/dp/0525954821/
- Understanding Industrial Experimentation — https://www.amazon.com/Understanding-Industrial-Experimentation-Donald-Wheeler/dp/0945320094/
- Islam and the Future of Tolerance — https://www.amazon.com/Islam-Future-Tolerance-Sam-Harris/dp/0674088700/
- Lying — https://www.amazon.com/Lying-Sam-Harris/dp/1940051002/
- Building Continual Improvement — https://www.amazon.com/Building-Continual-Improvement-Service-Industry/dp/0945320507/
- The Startup Way — https://www.amazon.com/Startup-Way-Companies-Entrepreneurial-Management/dp/1101903201/
It’s (Mostly) The System Not The Person

A common theme running through many recent articles, blog posts, and comments on issues of organizational performance is that managers/leaders are the problem: they are out of touch, they are arrogant and smug, they are selfish, and that they lack empathy or compassion. The gist being people in positions of power or authority should know better, be better.
I agree with Rasmus Hougaard and Jacqueline Carter, authors of the piece “Why Do So Many Managers Forget They’re Human Beings?” in Harvard Business Review, that “As human beings, we are all driven by basic needs for meaning, happiness, human connectedness, and a desire to contribute positively to others.”[1] This is so for the line-worker and the executive. I do not believe that anyone comes to work with the intent to make life miserable for another. But it happens. Why?
Religions have been telling us to “Be personal,” “Be self-aware,” “Be selfless,” “Be compassionate,” for ages. That is wise guidance for leaders and common man alike. But, as Dr. Deming asked, “By what method?” Without method that guidance is no different than exhorting a worker to “think quality,” “work hard,” “zero defects,” “get it right first time.”
Method, or process, or system, is essential in supporting our inner desire to live right. Organizations have organically evolved systems that directly conflict with and obstruct this desire. They’re so elaborate that even those supposedly in charge are trapped by it.[2] This isn’t intentional, it happens. It is the result of everyone doing their best without constancy of purpose. I now realize that no one in the system sees the system, and everyone is confused by and frustrated with it. What can we do?
We can all work to understand the system and share that with one another. Leaders can authorize that. However, we all are responsible for doing it. With shared understanding we can all work to redesign our system of work to humanize it. Again, leaders can authorize that, but we are all responsible for doing it. It is easy and comforting to divide ourselves into “us” and “them” and lay responsibility and fault on “them”. We’ve tried that; it hasn’t worked. Could we try something different?
It’s not just the managers who forget they’re human. We all do.
Links
[1] Hougaard, Rasmus and Jacqueline Carter. “Why Do So Many Managers Forget They’re Human Beings?” Retrieved on 2018.01.30 from https://hbr.org/2018/01/why-do-so-many-managers-forget-theyre-human-beings
[2] Consider Eric Ries’s experience from The Startup Way: “Many managers I’ve met and worked with know they’re being asked to do the wrong thing, but they continue to do it anyway because they feel trapped in a system of incentives that makes it impossible to do anything else.”
“Why?” Not “Who?”: Fixing Systems, Not Blaming Workers

Recently, Harvard Business Review published a video called “The 5 Whys” where Eric Ries, author of The Lean Startup and The Startup Way, explains the use of the method. He repeatedly, and incorrectly, suggests to the viewer that “behind every seemingly technical problem is actually a human problem waiting to be found.” Finding a human who failed to be singled out for blame won’t find and fix the deficiencies in the process or system. What we need is to improve the design of the process or system within which humans work.
…
You can read the full post on Mark Graban’s Lean Blog. Please click on the link — https://www.leanblog.org/2018/01/not-fixing-systems-not-blaming-workers/
Giving Thanks
Sooner or later we all realize that nothing happens of its own accord. I am because of all of you. For that I am grateful.
Thank you for being patient with me when I was restless and impulsive; when I got on my high horse; when I chose poorly; when my actions caused upset and hurt. I know how trying I can be. And if it weren’t for your calm steady presence I wouldn’t have been able to focus on what needed to get done. I’ve done what I’ve done, and have what I have, because you enabled me to.
Thank you for being there. I don’t ask for help, but you gave when I needed it–just enough to lift me over my hurdle; without imposing; without expectation; just because. My life wouldn’t be the joy it is without you in it. We may not have talked in ages, but you’re in my memories, just as real. For all our silly disagreements, I share a precious bond with each of you.
My Thanksgiving Day is wonderful for the relationships I am fortunate to have. I wish yours is wonderful, too!


Charting Change: Using an XmR Chart
Mark Graban’s blog post, “What Do We Learn from Charting a Reduction in CLABSI Rates in Different Ways?”, provides a great example of how to plot and analyze data.
Here I present my analysis, observations, and comments.
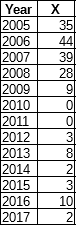
The data, which appears to be a count of central line associated blood stream infections (CLABSI) for each year starting 2005 and on through 2017, is shown in Table 1. According to Mark, it was presented by some leaders from a children’s hospital.
Table 1. Data for neonatal intensive care unit (NICU) central line associated blood stream infections (CLABSI) for 2005-2017
The simplest analysis that provides insight is the best analysis to perform. So, let’s plot the data (Figure 1).
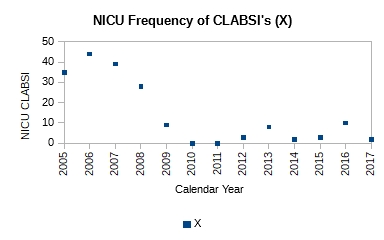 Figure 1. Plot of count of central line associated blood stream infections (CLABSI) for 2005-2017
It is obvious just from the plot in Figure 1 that the performance of the system has changed; it has improved. It has dropped from ~40 NICU CLABSIs for 2005-2007 to ~6 NICU CLABSIs for 2009-2017. Mark writes that a process change was made around 2008. However, no other details are available as to the nature of the change. Without further context all we can say is that the effect of the change made in 2008 in subsequent years is obvious and dramatic—evidence of effectiveness of action. No calculations were necessary to make this observation.
Still, we could add a center line to the plot (Figure 2) to gain further insight.
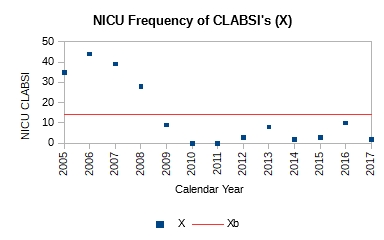 Figure 2. The addition of the center line (average of all 13 points), clearly shows two distinct runs: a run of four points for 2005-2008, and a run of nine points for 2009-2017. The run of nine points is unusual, and signals a process shift.
The center line is the mean, calculated using all 13 points. It is ~14. From the plot we see a run of four points above the mean and a run of nine points below the mean. The second run is unusual and signals a process shift. It supports the claim that a process change was made around 2008-2009. With a single calculation, the mean, we have corroborated our original observation.
If we want to predict the performance of the system in 2018 or 2019 or 2020, we need to construct an XmR chart. Knowing that there was a process change around 2008, we should focus on the system’s performance after that i.e. 2009 and beyond. Table 2 shows the calculations for the XmR chart.
Table 2. Calculations are shown for attributes necessary to plot an XmR chart. The calculations are shown just for the process thought to currently exist i.e. 2009-2017
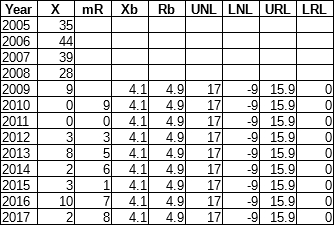
The moving range (mR) is calculated as the absolute value of the difference between the current and previous year e.g. mR for 2010 is calculated as |X2010 – X2009| = |0 – 9|, which is 9.
The mean value is calculate for just those points after the process change, i.e. 2009-2017, as (9+0+0+3+8+2+3+10+2)/9 = 37/9 = 4.1
The mean moving range is calculate as the average of all the calculated moving range values as (9+0+3+5+6+1+7+8)/8 = 39/8 = 4.9
The upper natural limit (UNL) is calculated as the mean + 2.66*mean range i.e. 4.1 + 2.66*4.9 = 17
The lower natural limit (LNL) is calculate as the mean – 2.66*mean range i.e. 4.1 – 2.66*4.9 = -9. However, because you cannot have negative count, the LNL is set to zero on the chart.
The upper range limit (URL) is calculated as 3.268*mean range i.e. 3.268*4.9 = 15.9
The lower range limit (LRL) is zero.
The XmR chart is shown in Figure 3.
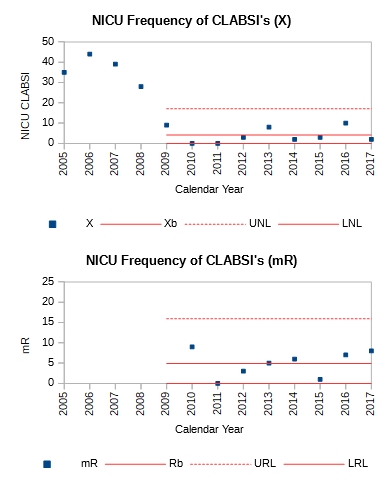 Figure 3. The natural process limits are shown for the current system with the UNL = 17, mean = 4.1, and LNL = 0. If the system continued to perform without change, we can expect between 0 and 17 CLABSIs in the next years.
From the XmR chart we can make the following predictions:
Provided the system continues to operate as it has the past few years, we can expect an average of ~4 CLABSIs in future years. There may be years where we could see up to ~17 CLABSIs. There may be years where there are none. Further more we can expect the counts to vary by ~5 on average from one year to the next. Some years may vary by as much as 16 counts. Others may not vary at all.
Management must decide whether this is adequate performance. If further reduction in NICU CLABSIs is wanted, new actions to improve the current system will need to be taken.
Links
[1] Graban, Mark. What Do We Learn from Charting a Reduction in CLABSI Rates in Different Ways?. Retrieved on 2017.11.01 from https://www.leanblog.org/2017/11/learn-charting-reduction-clabsi-rates-different-ways/
Book Review: “The Toyota Product Development System”
 Writers and readers are in a relationship. Each has responsibilities. The writer is responsible for the structural quality of his writing such as spelling, grammar, punctuation, and vocabulary. (The language should be invisible in high quality writing so that the reader can focus on the content i.e. the writer’s message.) The reader is responsible for being fluent in the language to understand high quality writing.
This book should never have been published just for its atrocious quality of writing. It is filled with spelling mistakes, terrible grammar, and horrid punctuation. These issues, in addition to needless Japanese jargon, car jargon, and undefined acronyms, interrupted reading so often that I had to put the book away every few pages. This is especially frustrating as the book is fundamentally about building quality in into a product! There is no indication that this was done in the production of this book.
I am deeply interested in the product development process. Experience with several companies has shown me that their respective product development process, if it exists as such, is poorly designed, poorly defined, and not effective in operation. So I have been studying—I’ve read Stuart Pugh’s “Total Design”[1], Don Clausing’s “Total Quality Development”[2], and Ulrich/Eppinger’s “Product Design and Development”[3], among other books and papers. Given that Toyota excels at bringing great products to market quickly, I really wanted to learn and understand its approach. So it was with this intent, and Jeffrey Liker’s reputation, that I picked up “The Toyota Product Development System”[4].
The book does not deliver what its title promises. The authors do not provide a model of the product development process, instead discussing the sociotechnical system (STS) at Toyota, the V-Comm communication system, and PDVSM—product development value stream mapping to improve the product development process. This is already superbly detailed in Jeffrey Liker’s “The Toyota Way”[5]. We get it—the product development process at Toyota is grounded in its world leading STS, but what is the process specifically? The authors don’t detail the product development process as I’ve come to expect from reading Pugh, Clausing, Ulrich/Eppinger. Perhaps that is a failure on my part.
How are design inputs collected and/or developed? How are those inputs converted into engineering terminology? If Toyota doesn’t use the House of Quality, what does it use? How are engineering requirements converted into sets of concepts? There is no usable explanation of set-based concurrent engineering. For crying out loud, Jeffrey Liker wrote several papers on this! What is the method for vetting various concepts? How does detailed engineering happen i.e. converting requirements into drawings? How are those concepts verified and/or validated? What type of testing is performed or skipped? When is it done? None of the things that would help a design and development engineer to understand the design and development process at Toyota is covered in any useful way.
When these questions are touched upon, they are done so piecemeal and superficially; disconnected from one another. The authors make the reader work very hard to extract nuggets from their writing. The discussion often happens in the context of an example, but the examples require you to know car terminology! So if you don’t have experience in the automobile industry, good luck trying to figure out what the authors are trying to communicate. (Thank you Google & Wikipedia for helping me see what is meant.) The matter is made worse by the fact that an example doesn’t carry through between discussion of topics.
One final note, there is a ridiculous amount of adoration of Toyota’s results that borders on worship. I didn’t care for that, especially when what I was looking for—the description of process—was missing. I didn’t buy the book for the authors to tell me how good Toyota is and how bad everybody else is. I already know this. It is unfortunate that several masters in lean wrote rave reviews for the book. I wonder if they bothered to actually read it. I am now less inclined to be guided by their reviews and recommendations. My suggestion to you is you skip this book. It isn’t worth anyone’s time.
Links
[1] Pugh, Stuart. Total Design. Addison-Wesley Publishers Ltd. 1991. ISBN 0-201-41639-5
[2] Clausing, Don. Total Quality Development. ASME Press: New York, NY. 1993. ISBN 0-7918-0035-0
[3] Ulrich, Karl T., and Steven D. Eppinger. Product Design and Development. New York, NY: McGraw Hill Education. 2012. Print. ISBN 978-93-5260-185-1
[4] Morgan, Kames M., and Jeffrey K. Liker. The Toyota Product Development System. New York, NY: Productivity Press. 2006. Print. ISBN 1-56327-282-2
[5] Liker, Jeffrey K. The Toyota Way. New York, NY: McGraw Hill. 2004. Print. ISBN 0-07-139231-9

